1. Overall bandwidth - nload, bmon, slurm, bwm-ng, cbm, speedometer, netload

2. Overall bandwidth (batch style output) - vnstat, ifstat, dstat, collectl


2. Bandwidth per socket connection - iftop, iptraf, tcptrack, pktstat, netwatch, trafshow

3. Bandwidth per process - nethogs

http://www.binarytides.com/linux-commands-monitor-network/
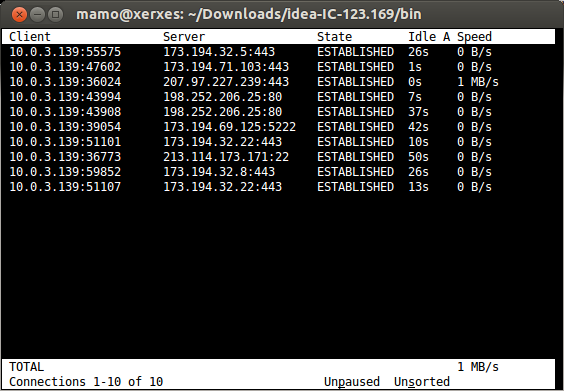
tcptrack
- A favorite. Tells how much bandwidth is being used and also what protocol (service/port) and destination the transmission is taking place to. Very helpful when you want to know exactly what is using up your bandwidth
design a system :
have a main server in the center( have the alerts functions and visualizaiton functions) , have the agent on each linux server ,the monitor server reach out the agent to ask for the inforamtion like how is the main drive , do w ehave the lots of space ,how is the ram dong, how is the cpu), the the agent get the information and rsponse back to the Nagios XI, serve r takes a look at it and do a lot of thing , first store the information ,and generate alert is in need
the other way is through native protocol snmp, the server ge to the switch which run snmp , to ask the smae question