1. Overall bandwidth - nload, bmon, slurm, bwm-ng, cbm, speedometer, netload
2. Overall bandwidth (batch style output) - vnstat, ifstat, dstat, collectl


2. Bandwidth per socket connection - iftop, iptraf, tcptrack, pktstat, netwatch, trafshow

3. Bandwidth per process - nethogs

http://www.binarytides.com/linux-commands-monitor-network/
-a (all)显示所有选项,默认不显示LISTEN相关
-t (tcp)仅显示tcp相关选项
-u (udp)仅显示udp相关选项
-n 拒绝显示别名,能显示数字的全部转化成数字。
-l 仅列出有在 Listen (监听) 的服務状态
-p 显示建立相关链接的程序名
-r 显示路由信息,路由表
-e 显示扩展信息,例如uid等
-s 按各个协议进行统计
-c 每隔一个固定时间,执行该netstat命令。
提示:LISTEN和LISTENING的状态只有用-a或者-l才能看到
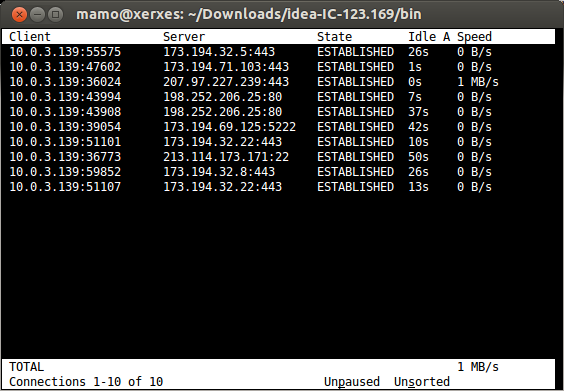
tcptrack
- A favorite. Tells how much bandwidth is being used and also what protocol (service/port) and destination the transmission is taking place to. Very helpful when you want to know exactly what is using up your bandwidth
design a system :
have a main server in the center( have the alerts functions and visualizaiton functions) , have the agent on each linux server ,the monitor server reach out the agent to ask for the inforamtion like how is the main drive , do w ehave the lots of space ,how is the ram dong, how is the cpu), the the agent get the information and rsponse back to the Nagios XI, serve r takes a look at it and do a lot of thing , first store the information ,and generate alert is in need
the other way is through native protocol snmp, the server ge to the switch which run snmp , to ask the smae question
TCP各种状态列表

wss8848@ubuntu:~$ netstat -nat |awk '{print $6}'
established)
Foreign
LISTEN
TIME_WAIT
ESTABLISHED
TIME_WAIT
SYN_SENT
  先把状态全都取出来,然后使用uniq -c统计,之后再进行排序。
  wss8848@ubuntu:~$ netstat -nat |awk '{print $6}'|sort|uniq -c
143 ESTABLISHED
1 FIN_WAIT1
1 Foreign
1 LAST_ACK
36 LISTEN
6 SYN_SENT
113 TIME_WAIT
1 established)
The basic format of an awk command looks like this:
awk 'pattern {action}' input-file >output-file
This means: take each line of the input file; if the line contains the pattern apply the action to the line and write the resulting line to the output-file.
If the pattern is omitted, the action is applied to all line. For example:
awk '{ print $5 }' table1.txt >output1.txt
This statement takes the element of the 5th column of each line and writes it as a line in the output file "output.txt".
expalin uicast flooding
When a switch receives aunicast frame(a frame with a specific mac address intended for a particular device), it looks for the frame's destination mac in its mac-address table. If there is no entry for the destination mac in its table, it will simply send the frame out to everyone connected to it's ports.
The frame is still a unicast frame, since it has a specific destination mac address in its header. The switch doesn't change any header data in the frame.
All the devices that receive the frame will compare the destination mac address in the frame with their own mac address and drops the frame if it doesn't match.
what is loop protection for ibgp , what should to with this ?
use the split horizon,need fully mesh
By default BGP speakers does not advertise iBGP-learned prefixes to iBGP peers - this is done to maintain loop prevention.
how RR works , how RR do the loop protection
When route reflector reflects a prefix, it creates/modifies an optional non-transitive attribute called CLUSTER_LIST by adding its own cluster ID to it. This attribute is used for loop prevention:
when router receives update which CLUSTER_LIST contains router's own cluster ID, this update is discarded.
ibgp to external destinations , what should set ?
explain fast retransmission?explain regular retransmission ?
InTCP/IP, fast retransmit and recovery (FRR) is a congestion controlalgorithm that makes it possible to quickly recover lost data packets. Without FRR, the TCP uses a timer that requires a retransmission timeout if a packet is lost. No new or duplicate packets can be sent during the timeout period. With FRR, if a receiver receives a data segment that is out of order, it immediately sends a duplicate acknowledgement to the sender. If the sender receives three duplicate acknowledgements, it assumes that the data segment indicated by the acknowledgements is lost and immediately retransmits the lost segment. With FRR, time is not lost waiting for a timeout in order for retransmission to begin
receive window , what is receive windows for ? memeory congestion of the receiver
what is the maxium window size ? how to calculate the max window size ?
how to use linux to analyse the tcp restansmission? where is linux store the result ?(temporily file system)
f or a general sense of the scale of your problem netstat -s will track your total number of retransmissions. # netstat -s | grep retransmitted
368644 segments retransmitted You can aso grep for segments to get a more detailed view:
# netstat -s | grep segments
149840 segments received
150373 segments sent out
161 segments retransmitted
13 bad segments received For a deeper dive, you'll probably want to fire up Wireshark.
What is BGP Route Reflector Cluster ID ?
Route Reflector Cluster ID is a four-byte BGP attribute, and, by default, it is taken from the Route Reflector’s BGP router ID.
If two routers share the same BGP cluster ID, they belong to the same cluster.
Before reflecting a route, route reflectors append its cluster ID to the cluster list. If the route is originated from the route reflector itself, then route reflector does not create a cluster list.
If the route is sent to EBGP peer, RR removes the cluster list information.
If the route is received from EBGP peer, RR does not create a cluster list attribute.
That’s why, if RRs use the same cluster ID, RR clients have to connect to both RRs.
ECMP
. There are three ways BGP and ECMP can work together:
- Bundling the links at the Ethernet level, using IEEE 802.3ad or EtherChannel
- With one BGP session over multiple links using loopback addresses
- With a separate BGP session over each of the parallel links
1. Slow Start
Old TCPs would start a connection with the sender injecting multiple segments into the network, up to the window size advertised by the receiver. While this is OK when the two hosts are on the same LAN, if there are routers and slower links between the sender and the receiver, problems can arise. Some intermediate router must queue the packets, and it's possible for that router to run out of space.
The algorithm to avoid this is called slow start. It operates by observing that the rate at which new packets should be injected into the network is the rate at which the acknowledgments are returned by the other end.
Slow start adds another window to the sender's TCP: the congestion window, called "cwnd". When a new connection is established with a host on another network, the congestion window is initialized to one segment (i.e., the segment size announced by the other end, or the default, typically 536 or 512). Each time an ACK is received, the congestion window is increased by one segment. The sender can transmit up to the minimum of the congestion window and the advertised window. The congestion window is flow control imposed by the sender, while the advertised window is flow control imposed by
the receiver. The former is based on the sender's assessment of perceived network congestion; the latter is related to the amount of available buffer space at the receiver for this connection.
The sender starts by transmitting one segment and waiting for its ACK. When that ACK is received, the congestion window is incremented from 1 to 2 to 4. This provides an exponential growth, although it is not exactly exponential because the receiver may delay its ACKs, typically sending one ACK for every two segments that it receives.At some point the capacity of the internet can be reached, and an intermediate router will start discarding packets. This tells the sender that its congestion window has gotten too large. Early implementations performed slow start only if the other end was on a different network. Current implementations always perform slow start.
2. Congestion Avoidance
Congestion can occur when data arrives on a big pipe (a fast LAN) and gets sent out a smaller pipe (a slower WAN). Congestion can also occur when multiple input streams arrive at a router whose output capacity is less than the sum of the inputs. Congestion avoidance is a way to deal with lost packets.
The assumption of the algorithm is that packet loss caused by damage is very small (much less than 1%), therefore the loss of a packet signals congestion somewhere in the network between the source and destination. There are two indications of packet loss: a timeout occurring and the receipt of duplicate ACKs. Congestion avoidance and slow start are independent algorithms with different objectives. But when congestion occurs TCP must slow down its transmission rate of packets into the network, and then invoke slow start to get things going again. In practice they are implemented together. Congestion avoidance and slow start require that two variables be maintained for each connection: a congestion window, cwnd, and a slow start threshold size, ssthresh. The combined algorithm operates asfollows:
Initialization for a given connection sets cwnd to one segment and ssthresh to 65535 bytes.
The TCP output routine never sends more than the minimum of cwnd and the receiver's advertised window.
When congestion occurs (indicated by a timeout or the reception of duplicate ACKs), one-half of the current window size (the
minimum of cwnd and the receiver's advertised window, but at least two segments) is saved in ssthresh. Additionally, if the
congestion is indicated by a timeout, cwnd is set to one segment(i.e., slow start).
When new data is acknowledged by the other end, increase cwnd, but the way it increases depends on whether TCP is performing slow start or congestion avoidance.

3. Fast Retransmit
In the past, TCP detected the wrong things inside the network, such as packet loss, network congestion, etc, by using only the "timeout" mechanism. After sending a data packet, TCP sets up its own timer particularly for the sent packet. The timer is usually set to theretransmission timeout period (RTO)which is determined by some other algorithms. If TCP correctly receives an ACK corresponding to the data packet before the timer is expired, TCP assumes that everything inside the network is fine. TCP, then, automatically resets the timer of just received ACK packet and continuously waits for the other ACK packets. However, if TCP does not get the desired ACK within RTO period, this will trigger TCP to retransmit the packet whose timer is expired. In addition to retransmit the lost packet, TCP starts slow-start again by reset cwnd to 1 and set ssthresh to (old cwnd / 2) due to the congestion control algorithm.
It was soon discovered that using only the timeout mechanism led to long periods of time (RTO period) in order to react to the wrong things happened inside the network. Therefore, a new mechanism called "fast retransmit" was added to TCP. Fast retransmit is a heuristic that sometimes triggers the retransmission of a dropped packet before the RTO period is up. It is worth to make things clear that fast retransmit does not supplant timeout mechanism. The timeout mechanism actives normally for a small window size, where packets in transit are not enough to cause fast retransmit. TCP can employ fast retransmit only in a large window size to enhance its performance and link utilization.
The idea of fast retransmit is straightforward. It only adds a tiny thing to the normal operation of TCP. Every time a packet with sequence number x arrives correctly at the receiver; the receiver acknowledges the packet #x by sending an ACK packet (containing the sequence number of another packet which it is waiting for - this number may or may not be "x+1") back to the sender. Therefore, when a packet arrives out of order (for example, 1 2 3 ... 5 : "4" is missing), TCP at the receiving side resends the last ACK packet to portray the expected packet again. This causes aduplicate ACKat the sending side. ("duplicate ACK" means the second, third, fourth, ... transmission of the same acknowledgement.) Fast retransmit plays an important role here. After receiving some numbers of duplicate ACKs, TCP at the sending side retransmits the missing packet without waiting for the timer to be expired. Moreover, receiving some numbers of duplicate ACKs means that the network congestion has been occured. Thus, TCP at the sending side resets cwnd to 1 and sets ssthresh to (old cwnd / 2) due to the congestion control algorithm; then starts slow-start again. In the practical TCP, the third duplicate ACKs triggers fast retransmit
Note !The reason that the sending side has to wait until the third duplicate ACK is described :
" Since TCP does not know whether a duplicate ACK is caused by a lost segment or just a reordering of segments, it waits for a small number of duplicate ACKs to be received. It is assumed that if there is just a reordering of the segments, there will be only one or two duplicate ACKs before the reordered segment is processed, which will then generate a new ACK. If three or more duplicate ACKs are received in a row, it is a strong indication that a segment has been lost. "
![]()
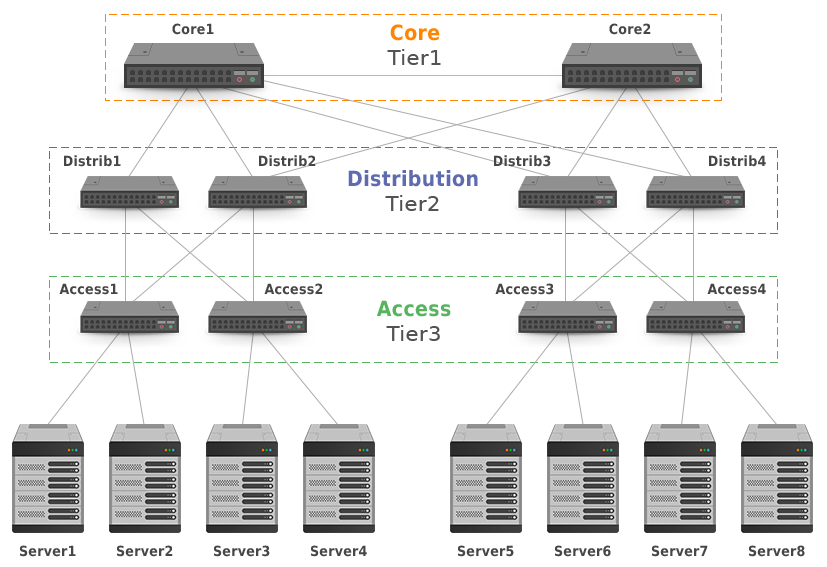
The layered approach is the basic foundation of the data center design that seeks to improve scalability, performance, flexibility, resiliency, and maintenance

•![]() Core layer—Provides the high-speed packet switching backplane for all flows going in and out of the data center. The core layer provides connectivity to multiple aggregation modules and provides a resilient Layer 3 routed fabric with no single point of failure. The core layer runs an interior routing protocol, such as OSPF or EIGRP, and load balances traffic between the campus core and aggregation layers using Cisco Express Forwarding-based hashing algorithms.
Core layer—Provides the high-speed packet switching backplane for all flows going in and out of the data center. The core layer provides connectivity to multiple aggregation modules and provides a resilient Layer 3 routed fabric with no single point of failure. The core layer runs an interior routing protocol, such as OSPF or EIGRP, and load balances traffic between the campus core and aggregation layers using Cisco Express Forwarding-based hashing algorithms.
•![]() Aggregation layer modules—Provide important functions, such as service module integration, Layer 2 domain definitions, spanning tree processing, and default gateway redundancy. Server-to-server multi-tier traffic flows through the aggregation layer and can use services, such as firewall and server load balancing, to optimize and secure applications. The smaller icons within the aggregation layer switch inFigure 1-1represent the integrated service modules. These modules provide services, such as content switching, firewall, SSL offload, intrusion detection, network analysis, and more.
Aggregation layer modules—Provide important functions, such as service module integration, Layer 2 domain definitions, spanning tree processing, and default gateway redundancy. Server-to-server multi-tier traffic flows through the aggregation layer and can use services, such as firewall and server load balancing, to optimize and secure applications. The smaller icons within the aggregation layer switch inFigure 1-1represent the integrated service modules. These modules provide services, such as content switching, firewall, SSL offload, intrusion detection, network analysis, and more.
•![]() Access layer—Where the servers physically attach to the network. The server components consist of 1RU servers, blade servers with integral switches, blade servers with pass-through cabling, clustered servers, and mainframes with OSA adapters. The access layer network infrastructure consists of modular switches, fixed configuration 1 or 2RU switches, and integral blade server switches. Switches provide both Layer 2 and Layer 3 topologies, fulfilling the various server broadcast domain or administrative requirements.
Access layer—Where the servers physically attach to the network. The server components consist of 1RU servers, blade servers with integral switches, blade servers with pass-through cabling, clustered servers, and mainframes with OSA adapters. The access layer network infrastructure consists of modular switches, fixed configuration 1 or 2RU switches, and integral blade server switches. Switches provide both Layer 2 and Layer 3 topologies, fulfilling the various server broadcast domain or administrative requirements.
This model scales somewhat well, but it is subject to bottlenecks if uplinks between layers are oversubscribed. This can come from latency incurred as traffic flows through each layer and from blocking of redundant links
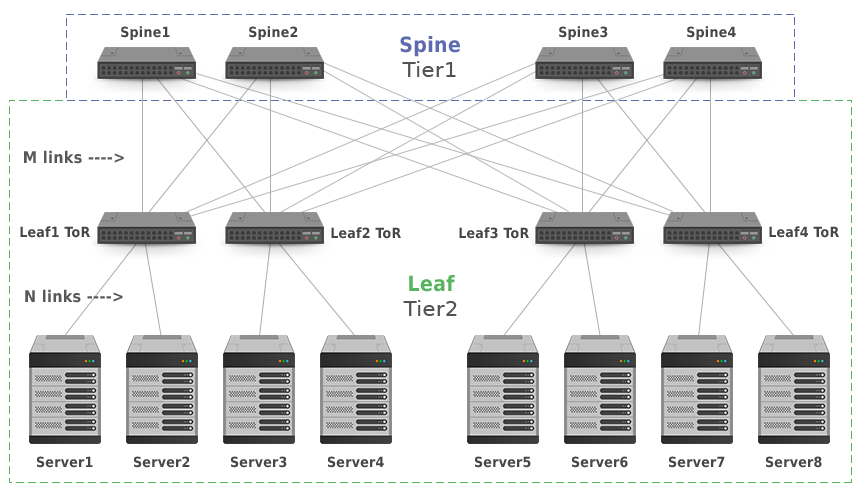
Leaf-spine data center architectures
Inmodern data centers, an alternative to the core/aggregation/access layer network topology has emerged known asleaf-spine. In a leaf-spine architecture, a series ofleafswitches form the access layer. These switches are fully meshed to a series ofspineswitches.Leaf-spine designs are pushing out the hierarchical tree data center networking model,
The mesh ensures that access-layer switches are no more than one hop away from one another,minimizing latency and the likelihood of bottlenecksbetween access-layer switches. When networking vendors speak of anEthernet fabric, this is generally the sort of topology they have in mind.

Leaf-spine architectures can belayer 2orlayer 3, meaning that the links between the leaf and spine layer could be eitherswitchedorrouted. In either design, all links are forwarding; i.e., none of the links are blocked, since STP is replaced by other protocols.
In a layer 2 leaf-spine architecture, spanning-tree is most often replaced with either a version ofTransparent Interconnection of Lots of Links(Trill) orshortest path bridging(SPB). Both Trill and SPB learn where all hosts are connected to the fabric and provide a loop-free path to their Ethernet MAC addresses via a shortest path first computation.
Brocade's VCS fabric and Cisco's FabricPath are examples of proprietary implementations of Trill that could be used to build a layer 2 leaf-spine topology. Avaya's Virtual Enterprise Network Architecture can also build a layer 2 leaf-spine but instead implements standardized SPB.
In a layer 3 leaf-spine, each link is a routed link.Open Shortest Path Firstis often used as the routing protocol to compute paths between leaf and spine switches. A layer 3 leaf-spine works effectively when network virtual local area networks are isolated to individual leaf switches or when a network overlay is employed.
question 1:
there are serval switches , check whether the switches can be ssh into , and print the unreachable switch
# I use the pexpect to run the code

import paramiko

ip = []

def connct(ip):
    ssh  = paramiko.SSHClinet()
    ssh.set_missing_host_key_policy(paramiko.AutoPolicy())
    ssh.connect(ip,22,'root','123456')
    if not ssh :
        print ' the server %s can not be ping'%ip
        ssh.close()
        return 0
    else : return 1


for ip in ip_list :
    if connct(ip) == 0 :
        ip.add(ip)
print ip

----------------------
stdin, stdout, stderr = ssh.exec_command(m)

outmsg,errmsg = stdout.read(),stderr.read()    #读一次之后,stdout和stderr里就没有内容了,所以一定要用变量把它们带的信息给保存下来,否则read一次之后就没有了
#!/usr/bin/env python

# -*- coding: utf-8 -*-

import pexpect

def ssh_cmd(ip, passwd, cmd):
    ret = -1
    ssh = pexpect.spawn('ssh root@%s "%s"' % (ip, cmd))
    ssh.logfile = sys.stdout
    try:
        i = ssh.expect(['password:', 'continue connecting (yes/no)?'], timeout=5)
        if i == 0 :
            ssh.sendline(passwd)
        elif i == 1:
            ssh.sendline('yes\n')
            ssh.expect('password: ')
            ssh.sendline(passwd)
        ssh.sendline(cmd)
        r = ssh.read()
        print r
        ret = 0
    except pexpect.EOF:
        print "EOF"
        ssh.close()
        ret = -1
    except pexpect.TIMEOUT:
        print "TIMEOUT"
        ssh.close()
        ret = -2
    return ret

      利用pexpect模块我们可以做很多事情,由于他提供了自动交互功能,因此我们可以实现ftp,telnet,ssh,scp等的自动登录,还是比较实用的。根据上面的代码相信读者已经知道怎么实现了(python就是那么简单!)。
      用上面的代码去完成任务还是比较费时间的,因为程序要等待自动交互出现,另外ubuntu用ssh连接就是比较慢,要进行一系列的验证,这样才体现出ssh的安全。我们要提高效率,在最短的时间内完成。后来我发现了python里面的paramiko模块,用这个实现ssh登录更加简单。看下面的代码:


#-*- coding: utf-8 -*-

#!/usr/bin/python
import paramiko
import threading


def ssh2(ip,username,passwd,cmd):
    try:
        ssh = paramiko.SSHClient()
        ssh.set_missing_host_key_policy(paramiko.AutoAddPolicy())
        ssh.connect(ip,22,username,passwd,timeout=5)
        for m in cmd:
            stdin, stdout, stderr = ssh.exec_command(m)
#           stdin.write("Y")   #简单交互,输入 ‘Y’
            out = stdout.readlines()
            #屏幕输出
            for o in out:
                print o,
        print '%s\tOK\n'%(ip)
        ssh.close()
    except :
        print '%s\tError\n'%(ip

if __name__=='__main__':
    cmd = ['cal','echo hello!']#你要执行的命令列表
    username = ""  #用户名
    passwd = ""    #密码
    threads = []   #多线程
    print "Begin......"
    for i in range(1,254):
        ip = '192.168.1.'+str(i)
        a=threading.Thread(target=ssh2,args=(ip,username,passwd,cmd))
        a.start()

上面的程序还是有些技巧的:

1.利用多线程,同时发出登录请求,同时去连接电脑,这样速度快很多,我试了一下,如果不用多线程,直接一个一个挨着执行的话,大约5~10秒钟才能对一台电脑操作完,具体时间要根据命令的来决定,如果是软件安装或者卸载时间要更长一些。这样下来怎么也要一二十分钟,用多线程后就快多了,所有的命令执行完用了不到2分钟!

2.最好用root用户登录,因为安装或者卸载软件的时候如果用普通用户又会提示输入密码,这样又多了一次交互,处理起来就比较麻烦!安装软件时apt-get install xxx 最好加上“-y”参数,因为有时安装或删除软件时提示是否继续安装或卸载,这又是一次自动交互!加上那个参数后就没有人机交互了。

3. 循环时循环所有ip,因为计算机的ip是路由器自动分配的,保险起见,最好全部都执行,保证没有遗漏的主机

4.远端执行命令时如果有交互,可以这样用 stdin.write("Y")来完成交互,“Y”就是输入“Y”。

5.把所有的命令放到一个列表里面,遍历列表可以依次执行列表里面的命令

6.为了更好的进行控制,最好在电脑上提前把root用户打开,装好ssh服务器并让其开机自动执行
#检测服务器是否能ping通,在程序运行时,会在标准输出中显示命令的运行信息
def pingServer(server):
    result=os.system('ping '+server+' -c 2')
    if result:
        print '服务器%s ping fail' % server
    else:
        print '服务器%s ping ok' % server
    print result
question 2 :
there is a file with content as below :
'''switchname interface, input ,output
switch1,eth1,1234,3454
switch1,eth2,2335,3541
switch1,eth3,4567,2389'''
sort the output stream from high to low
list1 = []
with open('txt.py','r'0 as f :
    for line in f.readlines():
        if line.startswith('switch1'):
            list1.append(line.strip())

list2 = sorted(list1,key=lambda x : x.split(',')[3],reverse =True)
dict1 = {}
with open('txt.py','r') as f :
  for lines in f.readlines():
    if 'interface' in lines:
      continue
    dict1[lines.split(',')[0] + lines.split(',')[1]] = lines.split(',')[3].strip()

#sort dictionary by values from high to low
for key, value in sorted(dict1.iteritems(), key=lambda (k,v): (v,k),reverse = True):
    print "%s: %s" % (key, value)
from collections import OrderedDict
d_sorted_by_value = OrderedDict(sorted(dict1.items(), key=lambda x: x[1]))
for k, v in d_sorted_by_value.items():
  print "%s: %s" % (k, v)